

Investigators have found PFAS in major rivers, urban lakes and fish caught far from a factory gate. The records below show where the chemicals appeared, how researchers found them and what happened next.
What the tests mean: PFAS are a large family of manufactured chemicals, many of which break down slowly. The EPA links exposure to some PFAS with harmful health effects, but a positive sample alone does not establish the risk from a particular visit. These are documented cases, not a ranking of America’s most contaminated waters. EPA background
1. Cape Fear River, North Carolina: stopping a discharge was only part of the job
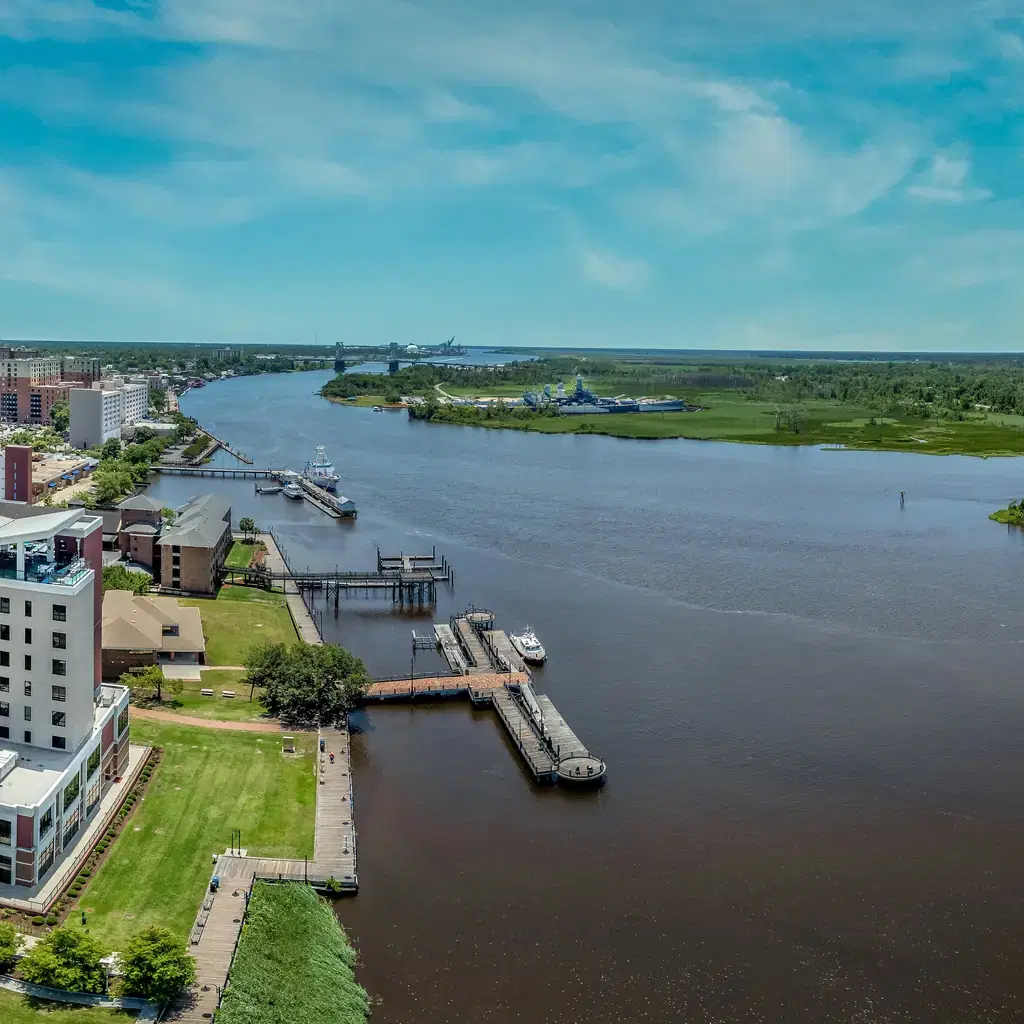
North Carolina began investigating GenX in the Cape Fear River in June 2017. The investigation connected an unfamiliar chemical name with a practical concern: the river supplies water to downstream communities.
GenX belongs to the PFAS family. State monitoring has included river locations near and downstream of the Chemours Fayetteville Works site, as well as water-treatment facilities along the river. The testing is intended to follow contamination through a system, rather than rely on one isolated sample. NC DEQ investigation; sampling locations
The cleanup requirements reveal why the story continued after attention turned to industrial discharges. Chemours’ consent-order obligations address PFAS reaching the river through several pathways, including contaminated groundwater and stormwater.
That is the difficult part of a long-lived chemical release. Material already in the environment can keep moving after the original discharge is controlled. The river result and the treated water supplied to a home are also different measurements; the latter needs the relevant utility’s own testing record. NC DEQ consent-order information
2. Washington Lake, New York: an airport investigation reached a city’s reservoir
Newburgh’s Washington Lake became part of a PFAS investigation in 2016. New York’s Department of Environmental Conservation sampled the lake and its tributaries, then identified Stewart Air National Guard Base as a source of the contamination.
The investigation linked the problem to firefighting foam. Water moving away from areas where the foam had been used provided a route toward the reservoir. That connection turned what might sound like an airport-site issue into a city water-supply problem. New York DEC’s Newburgh investigation
Newburgh changed its drinking-water source in 2016. Historical results from the reservoir therefore should not be presented as if residents are drinking the same untreated water today. The state’s health information explains the response and the distinction between past exposure and subsequent water-supply changes. New York Department of Health
Fish became another part of the investigation. A lake can stop serving as a water source while contamination in its food web still requires attention. It is one reason the drinking-water story and the fishing story must be followed separately.
3. San Francisco Bay, California: researchers found a mixture across the estuary

In 2021, researchers sampled water at 22 locations in San Francisco Bay and tested for 40 PFAS. Eleven of those compounds were detected, and seven appeared in at least half the samples.
That finding matters because “PFAS” is often discussed as though it were one pollutant. The bay survey instead found a mixture, with different compounds appearing at different frequencies. PFOA was detected in 77 percent of samples; another compound, PFHxA, appeared in 86 percent. San Francisco Estuary Institute’s water study
The institute’s wider monitoring work points to pathways such as stormwater and wastewater. Those routes help explain how products and activities spread across a large urban area can contribute to contamination in a shared water body. The distribution also varies within the bay, with higher levels generally reported in the South Bay. SFEI PFAS research
A waterfront photograph cannot reveal that mixture. The useful picture comes from multiple sampling locations and repeated monitoring, which can show differences that the broad label “San Francisco Bay” hides.
4. Lake Washington’s watershed, Washington: the study followed water before it reached the lake
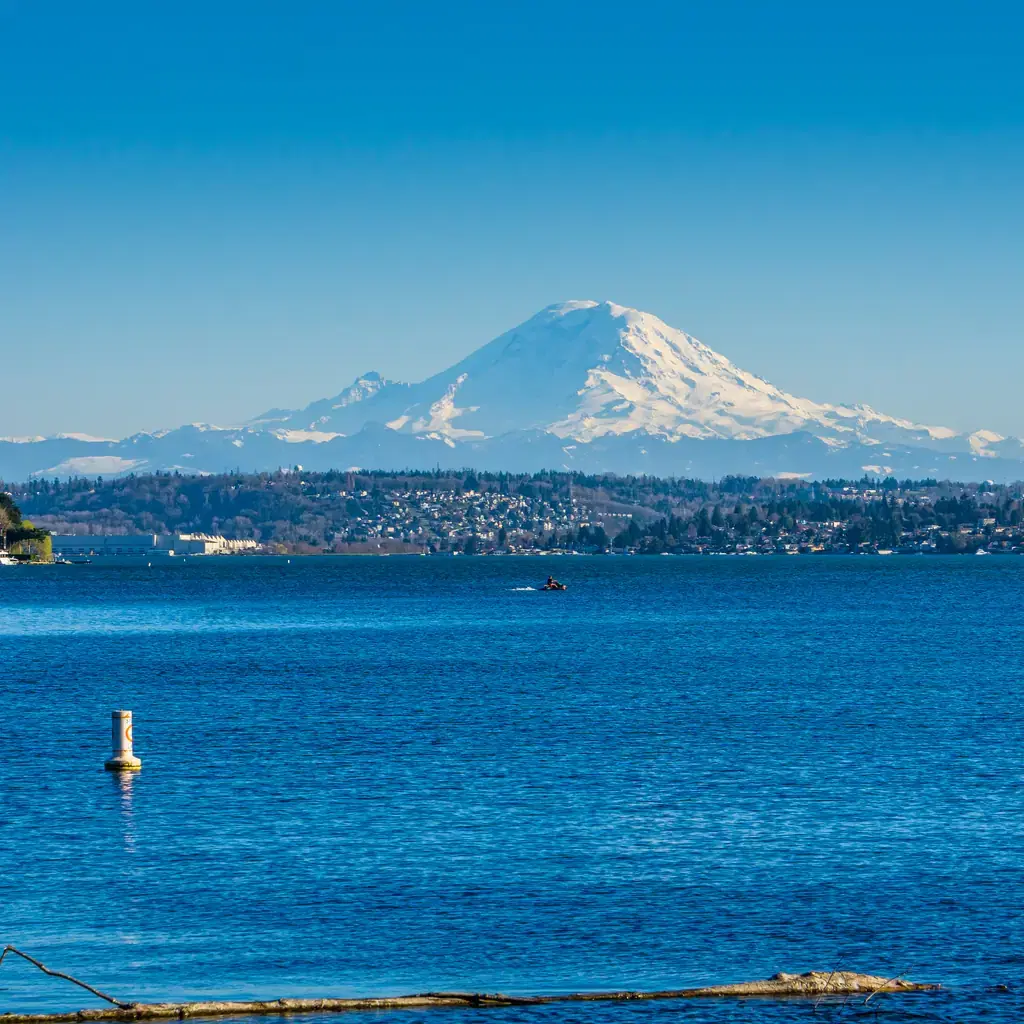
Washington researchers did not stop at collecting bottles of lake water. They also sampled tributaries, groundwater, stormwater and material deposited from the atmosphere to investigate how PFAS could reach Lake Washington.
A Department of Ecology account of the 2020–2021 work reported detections in 224 of 226 samples across those different sources and sample types. That does not mean 224 separate lake-water samples were positive. The distinction matters because the study was examining the routes into the lake as well as the lake itself.
Among the 40 PFAS included in the analysis, PFOS and PFOA were the most frequently detected. The findings gave investigators places to look more closely during later work.
This case is useful precisely because the search extended beyond a single suspected pipe. An urban lake receives water and pollutants through many connections. Sampling those connections helps identify where an intervention might matter, instead of treating the lake as an isolated bowl of water. Department of Ecology researchers’ account in the Puget Sound toxics-monitoring synthesis
5. Ohio River: a long river needed more than one sampling day
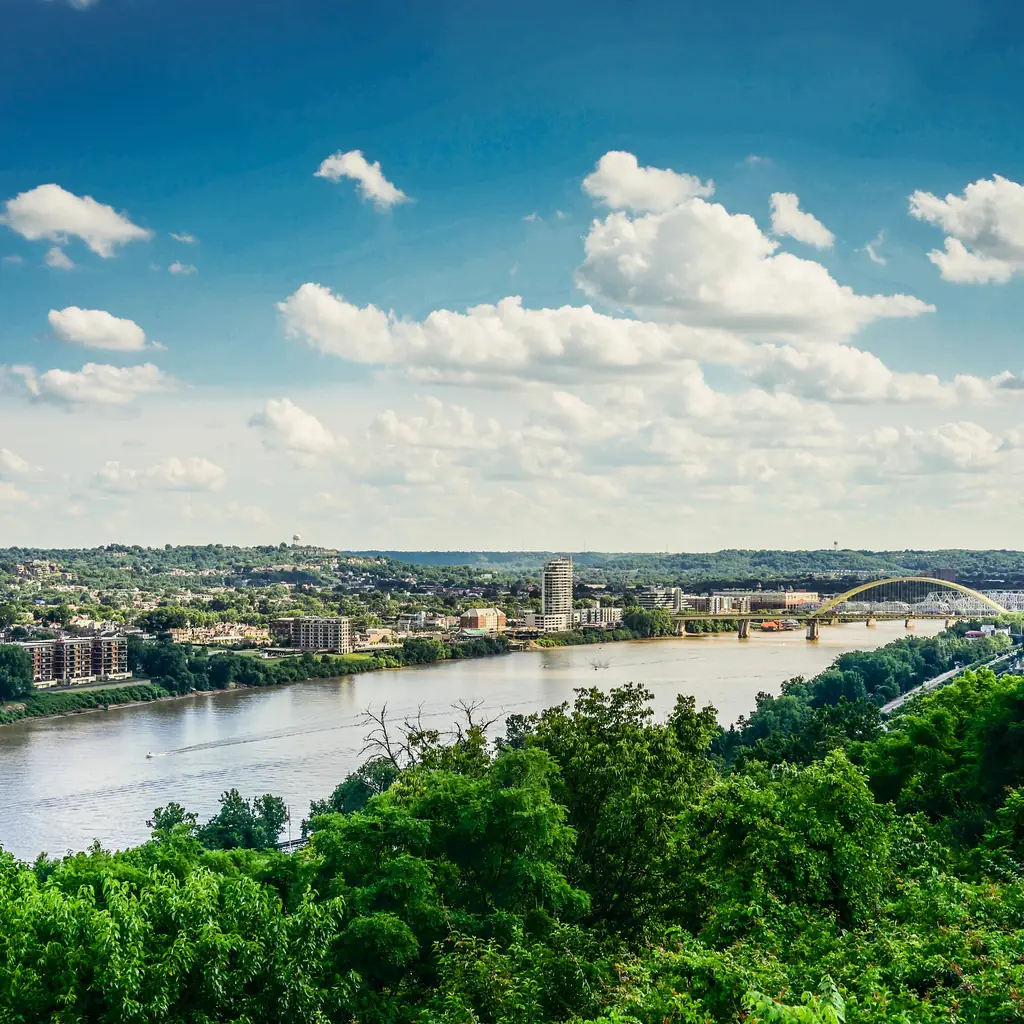
The Ohio River Valley Water Sanitation Commission’s 2021 investigation sampled 20 locations under both higher- and lower-flow conditions. Researchers tested for 28 PFAS, detected 12 and reported six at quantifiable concentrations in at least one sample.
The distinction between detecting a chemical and measuring it confidently is important. A laboratory can find evidence of a substance near its detection limit without being able to assign the same confidence to a precise concentration.
The survey included well-known compounds such as PFOA and PFOS, as well as GenX. It was a study of ambient river water. ORSANCO explicitly cautioned that the work was not designed to determine drinking-water safety or complete a human-health risk assessment. ORSANCO’s PFAS program; 2021 survey report
For a river this long, sampling location and flow belong in the story. A result at one point cannot describe every downstream community, every season or the treated water leaving each city’s plant.
6. Delaware River: the investigation went beyond the water column
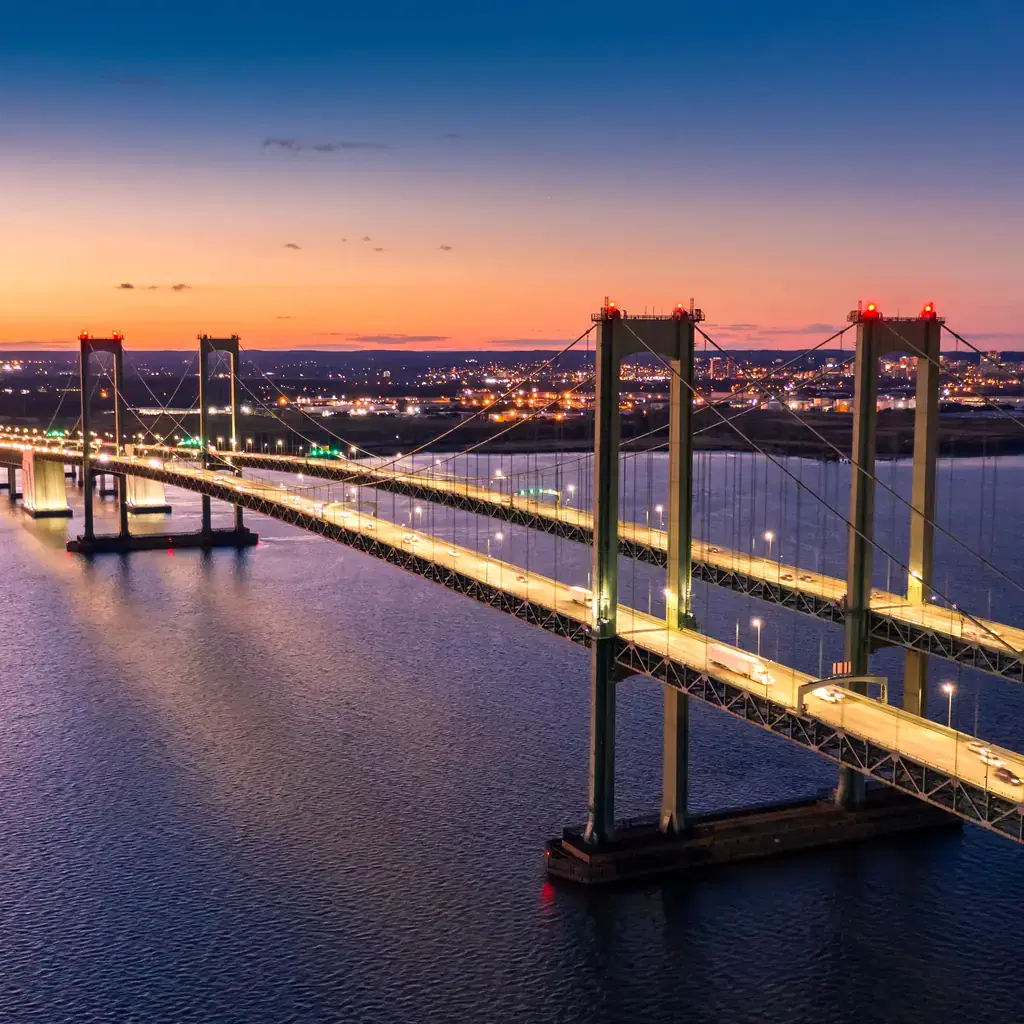
The Delaware River Basin Commission’s three-year investigation examined water, sediment, fish and blue crabs. Its May 2026 report found PFAS at nearly every sampled water location, with concentrations generally increasing downstream, particularly in the tidal river.
That downstream pattern gave investigators a geographic question to pursue. The report identified a stretch between Chester, Pennsylvania, and Pea Patch Island where additional inputs needed investigation. A changing concentration along the river can suggest where to look without proving which individual facility supplied the chemicals.
The fish and crab samples added another dimension. A water sample captures conditions at the place and time it was collected. Tissue testing examines what has reached organisms living within the system.
Together, the sample types offer a more complete account than a single positive test. They help distinguish contamination moving in the water from chemicals appearing elsewhere in the river environment, while leaving source questions open where the evidence has not resolved them. Delaware River Basin Commission’s May 2026 study summary
7. Huron River, Michigan: the fish record shows why species and location matter
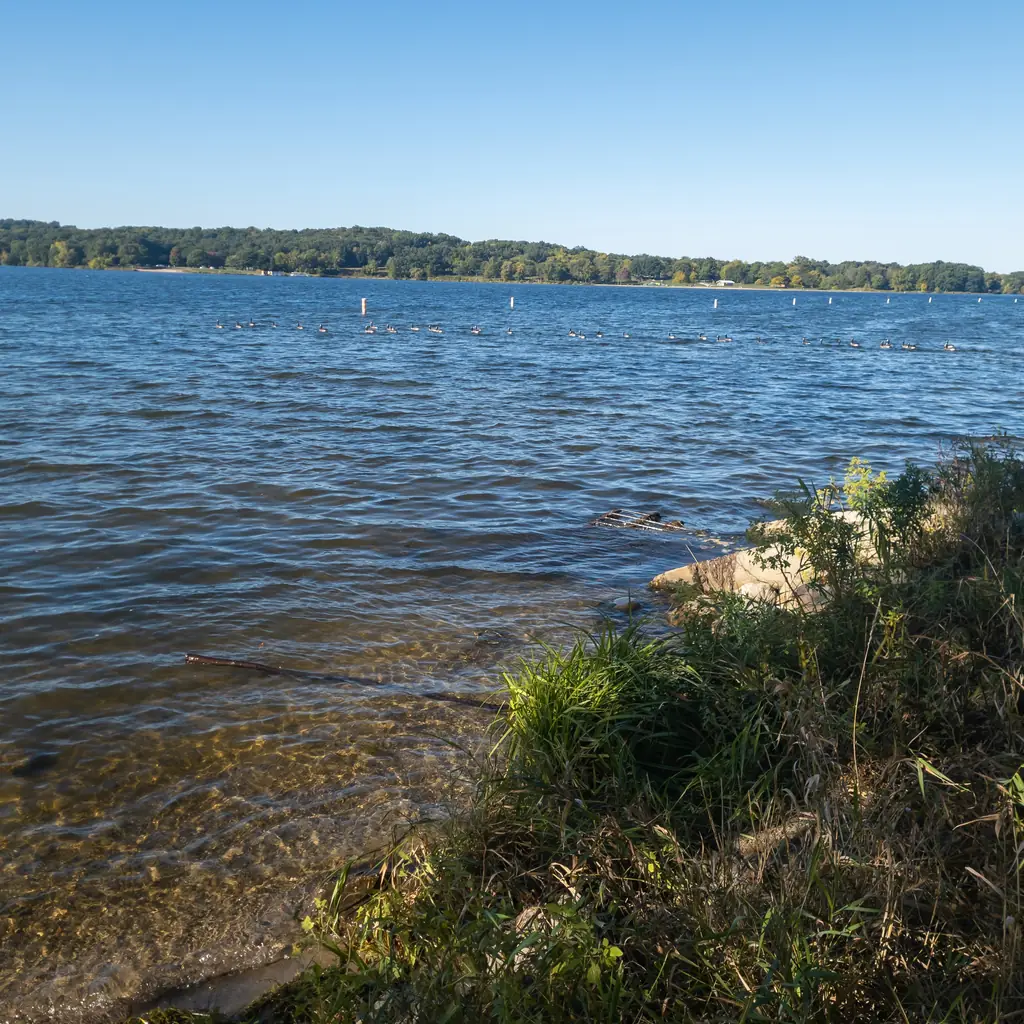
Michigan’s Huron River investigation intensified after Ann Arbor detected PFAS in the river, an important source of the city’s drinking water. Investigators also found PFOS in fish and began tracing sources through the wider watershed.
The state’s fish table makes the problem more specific than a river-wide label. For example, largemouth bass collected from Kent Lake in 2017 contained reported PFOS concentrations of 1,016–1,998 parts per billion. Largemouth bass collected there in 2024 ranged from 8.0–75.0 parts per billion.
Those are fish-tissue measurements from different sample collections, not river-water concentrations or repeated tests of the same fish. The lower later range is encouraging, but it cannot establish that every species or every part of the watershed now has the same condition.
Michigan’s investigation page pairs the monitoring record with links to its Eat Safe Fish guidance. That pairing is valuable: the historical record explains what investigators found, while the current guidance addresses what anglers should do with a particular catch. Michigan’s Huron River investigation and fish results
8. Lake Monona, Wisconsin: neighboring lakes did not produce identical results

Wisconsin’s 2020 sampling found PFAS across the Madison-area lakes, but the concentrations differed. Lake Monona had PFOS measurements as high as 9.2 parts per trillion, while the reported values for upstream Lake Mendota were below 1.0 part per trillion for PFOS and PFOA.
The pattern made a broad statement such as “PFAS in Madison lakes” less useful than the individual results. Monona and several downstream waters had higher concentrations than the upstream lakes in that survey.
The samples were tested for 36 PFAS at the Wisconsin State Laboratory of Hygiene. Monona’s PFOS results were also broadly similar to the state’s 2019 measurements, so the finding was not simply a single new positive test.
Earlier water and fish findings in Monona and Starkweather Creek had already prompted a PFAS fish-consumption advisory. The connected waters made source investigation important, but their separate measurements remained essential. A high creek result should never be relabeled as the concentration throughout the lake. Wisconsin DNR’s sampling announcement
9. Starkweather Creek, Wisconsin: a smaller waterway helped explain a larger concern
Starkweather Creek flows toward Lake Monona, making it an important place to investigate contamination entering the lake. Wisconsin’s January 2020 summary described testing of both creek water and fish after PFAS concerns drew attention to the area.
The investigation included sites along the creek, with the highest water concentrations reported near the airport area. Sampling along a smaller waterway can help narrow a search that would be much harder if investigators looked only at the receiving lake.
The same report included October 2019 Lake Monona samples, where PFOS ranged from 9.8 to 12 parts per trillion. Those lake results belonged to their own collection points and dates. Keeping them separate from the creek measurements preserves the actual pattern in the evidence.
The story here is the connection: a tributary can help carry contamination toward a much larger recreational lake. Understanding that connection requires a map, sampling locations and dates, rather than simply choosing the largest number in a report. Wisconsin DNR’s January 2020 investigation summary
10. Van Etten Lake, Michigan: shoreline foam told a different story from open water
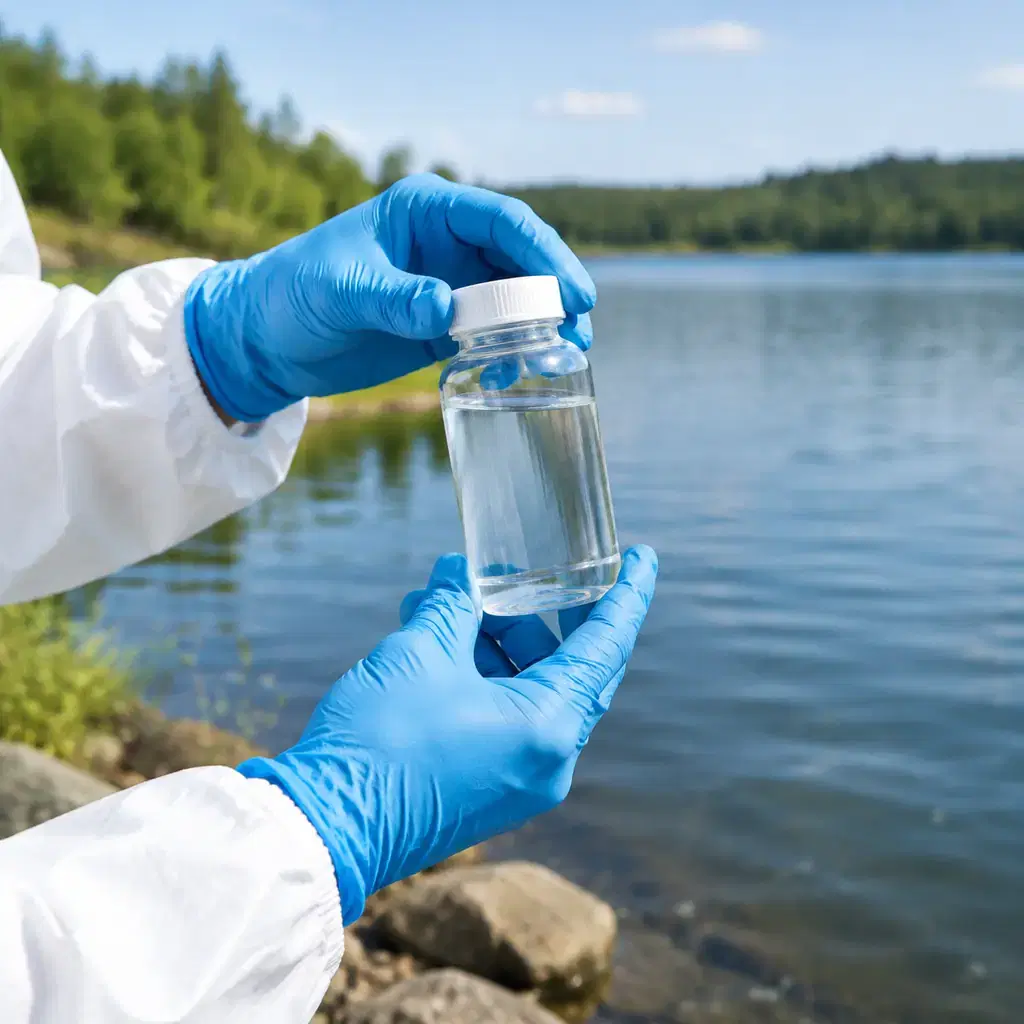
PFAS-contaminated foam was identified on Van Etten Lake in 2017, years after contamination had been found in groundwater at the former Wurtsmith Air Force Base nearby. Michigan identifies firefighting-foam use at the base as the principal cause of contamination at that site.
A state report released in June 2026 revisited paired foam and water samples collected in March 2020. The sampling covered three locations, including a park near contaminated groundwater entering the lake, a dam area and a campground boat launch.
That design matters. Foam and the underlying water are different sample types, and conditions can differ across a lake. The study examined those differences instead of assuming that a dramatic shoreline result represented the entire water body.
Van Etten is a clear example of why a photograph of foam cannot provide a chemical measurement. Laboratory testing, the exact location and the material sampled are what turn an unsettling sight into evidence that investigators can use. Michigan EGLE’s 2026 comparison report
11. Lake Margrethe, Michigan: the investigation followed contamination below the shoreline
Lake Margrethe, near Camp Grayling, was among the Michigan waters where investigators tested shoreline foam during 2018–2020. The state published results for both foam and surface water rather than treating them as interchangeable measurements. Michigan’s foam-testing record
Later work examined surface water and pore water, the water held within sediment. That expands the investigation beneath the visible surface, where groundwater and lake sediments can form part of the route into a lake.
A 2025 state letter discussed continuing concerns about groundwater plumes, stormwater entering Lake Margrethe and treatment performance. The issue therefore extended beyond whether a patch of foam happened to be visible on a particular day. Camp Grayling/Lake Margrethe investigation; EGLE’s August 2025 letter
The useful question is how contamination moves through the whole setting. A clean-looking shoreline cannot resolve that question, and neither can a foam photograph without testing. The investigation needs the less visible connections as well.
12. Mississippi River Pools 2–4, Minnesota: fish testing changed the advice
In March 2024, Minnesota updated fish-consumption guidance for Mississippi River Pools 2, 3 and 4, from the St. Paul area toward Wabasha. The announcement cited a mixture of pollutants, including PFAS, found in fish tissue.
That is a different finding from a test of drinking water. The practical concern was eating fish caught in the affected waters, including connected Minnesota lakes and backwaters.
The guidance distinguished between sensitive populations and the general population. Minnesota subsequently included additional connected waters in its published advice, demonstrating why a familiar river name alone is not enough to identify the relevant recommendation. Minnesota Department of Health’s March 2024 announcement; waterbody-specific guidance
A location can remain a place people enjoy fishing while the recommendation for taking fish home changes. Before keeping a catch, use the current state guidance for the exact pool or connected water. The dated investigation explains the finding; it should not replace that live advice.
13. Shawsheen River, Massachusetts: one sample could contain many PFAS

A USGS study of Massachusetts rivers and streams in 2020 found as many as 16 PFAS in samples from the Shawsheen River. The highest PFOS concentration reported in that statewide study, an estimated 55 nanograms per liter, also came from the Shawsheen.
The result illustrates why a test for one well-known compound cannot describe the entire PFAS mixture. A sample may contain several substances, each with a different concentration and a different amount of available health research.
The broader study collected 192 environmental water samples at 64 sites between August and November 2020. Researchers also collected quality-control samples, which help assess whether the measurements are reliable.
These are dated river-water results, not a finding about every household tap or every river condition since then. They show what a systematic survey can uncover in a waterway that might otherwise receive less attention than a nationally known river. USGS Massachusetts surface-water study
14. Pompton River watershed, New Jersey: repeated sampling found a persistent mixture
USGS researchers collected 32 samples from eight locations in the Pompton River watershed during their 2025 study. Eight PFAS were detected in every one of those samples taken at or near base-flow conditions.
Individual samples contained between eight and ten detected PFAS. PFOA concentrations ranged from 4.1 to 22 nanograms per liter, while PFOS ranged from 1.8 to 8.7 nanograms per liter.
The point of those numbers is the repeated pattern across sampling locations and seasons. They describe a study area and sampling design, not one anomalous bottle. The published analysis also reported differences between compounds: PFOA varied across places and seasons, while PFOS was comparatively consistent across the sampled watershed.
Because the study concerns surface waters used as water resources, it can inform treatment and source-management decisions. It does not establish the quality of finished drinking water at every nearby home. That question requires results from the water system supplying it. USGS’s 2026 Passaic Basin report, Pompton watershed results
15. Lower Farmington River, Connecticut: the follow-up changed the story
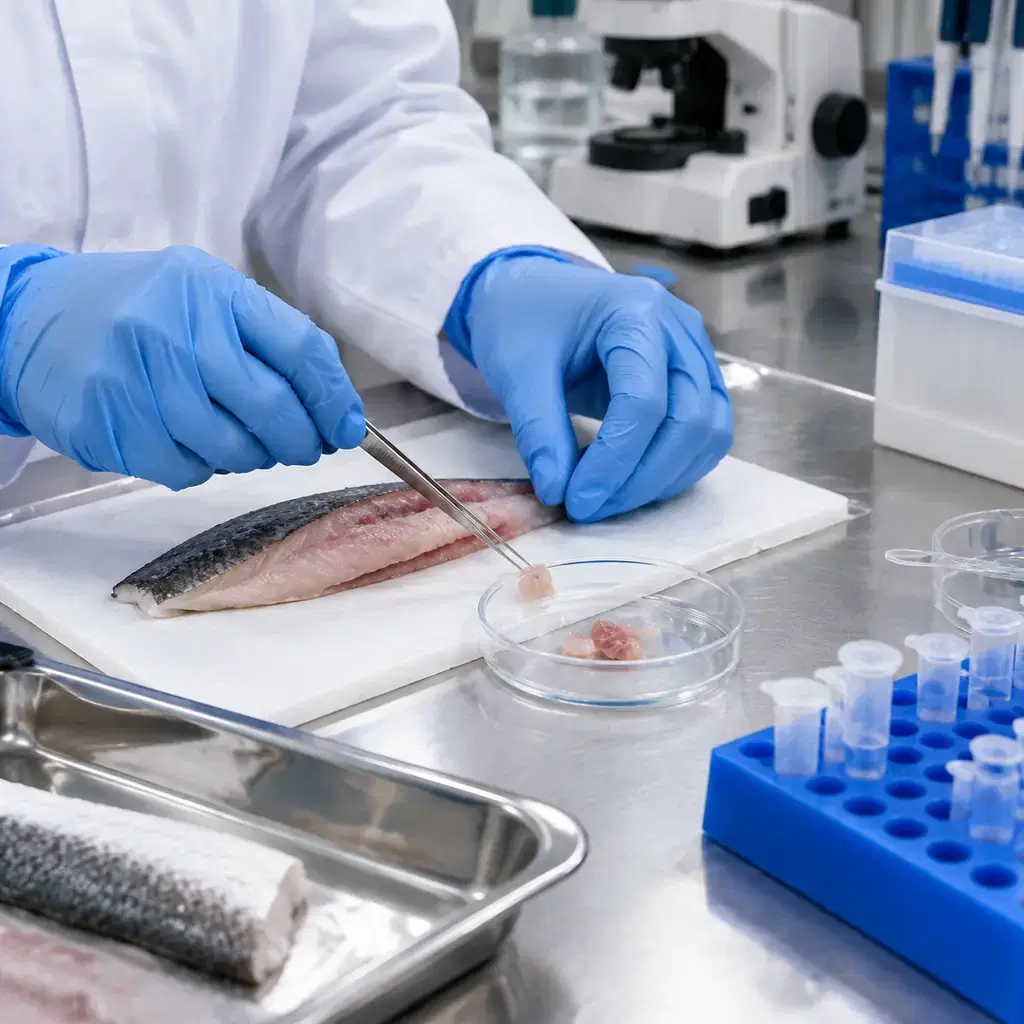
After a firefighting-foam release in 2019, Connecticut investigated fish in the lower Farmington River. Downstream tissue samples reported by the state measured PFAS at 172 parts per billion in July 2019 and 62 parts per billion that September.
The next year’s testing produced a much lower result. Fish collected in July 2020 measured 18 parts per billion, and the state removed the incident-related advisory in December 2020.
Those numbers describe fish tissue from successive collections, not a river-water concentration. The state based its decision on validated follow-up results, which is exactly why repeat testing matters after a release.
The removal also had a defined scope. Connecticut noted that other statewide fish advisories still applied. An improvement in one contamination incident did not erase every other reason for advice about fish consumption.
This case deserves a place beside the more troubling findings. A useful account of contamination should follow the evidence when conditions improve as well as when a new problem is found. Connecticut Department of Public Health’s December 2020 announcement
What to look up before a visit
For fishing, use the current state advisory for the precise water body and species. For drinking water, look for the supplying utility’s recent test results; an environmental sample from a river or lake is not the same as treated tap water.
Swimming restrictions, fish advisories and drinking-water notices answer different questions. The links in this article document the findings and investigations, with dates included so an old result is not mistaken for a current closure.
Research checked September 21, 2026. Concentrations are reported in their original units. Parts per billion in fish tissue must not be compared directly with parts per trillion in water.
Comments
The opinions and views expressed in the comments section are solely those of the individual users and do not represent or reflect the opinions, views, or positions of HumbleTrail. HumbleTrail does not endorse, support, or verify the accuracy of any user-generated content.
By posting a comment you agree to receive related emails from HumbleTrail in accordance with our Terms and Privacy Policy. You can unsubscribe at any time.